This is part 3 of our 5-part series on improving the performance of the Spring-petclinic application. Here are part 1 and part 2.
Yesterday we managed to make the application handle 5000 users, with an average performance of 867 req/sec. Let’s see if we can improve this today.
Removing the JVM locks
Running the tests from part 2 showed us that some requests are taking a lot longer than the others, in fact our application does not answer requests fairly to all users.
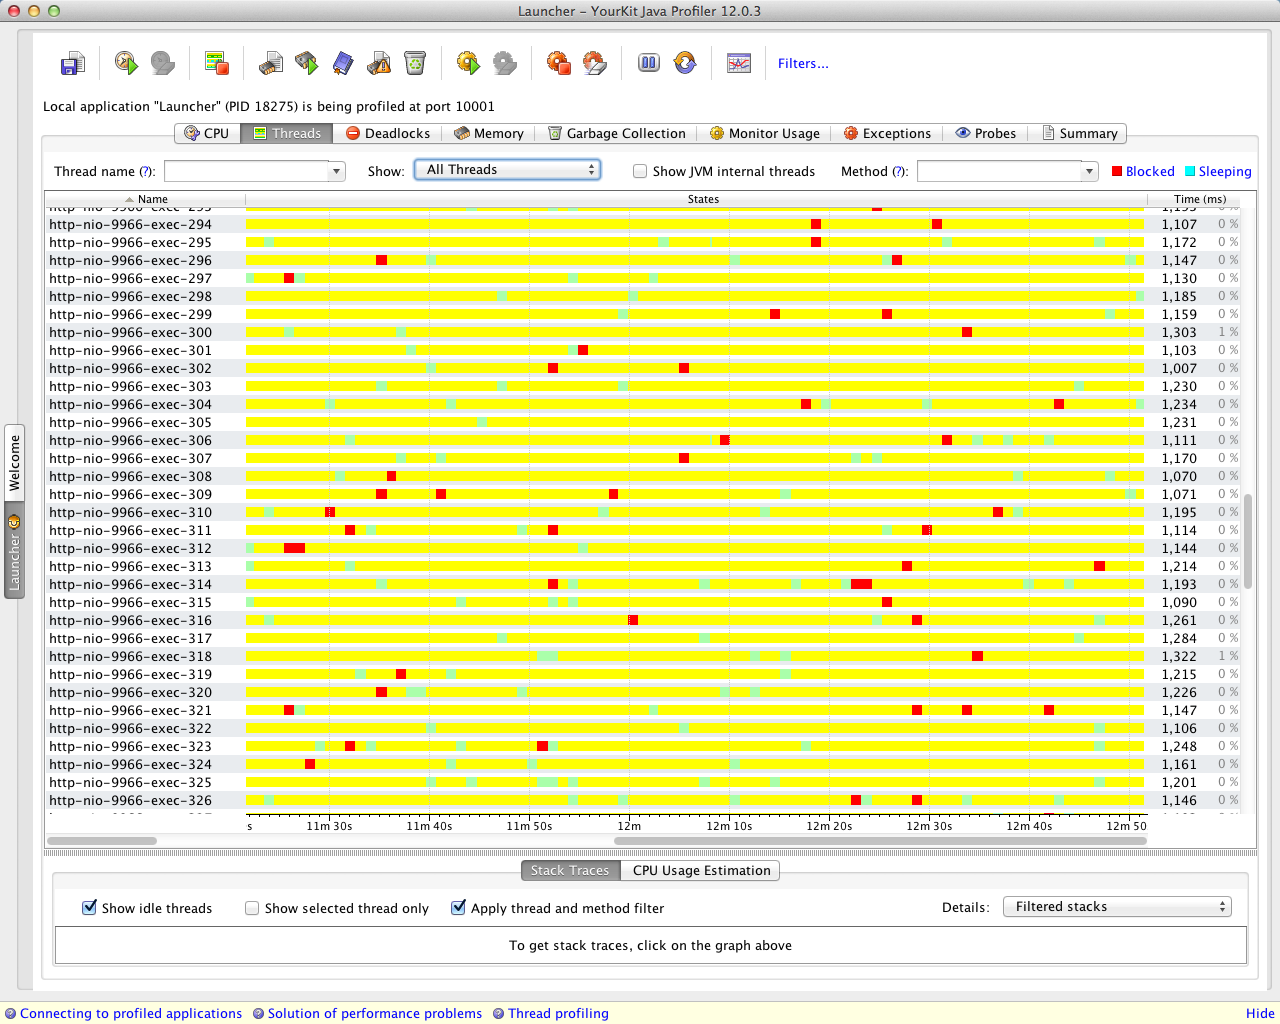
As this is rather strange, we run up YourKit again, this time to check if we have some locked threads in the JVM:

This YourKit screenshot shows a profiling session, where each time a thread is locked it becomes red.
It seems we have a few locks! This explains why some requests are really slow, they are getting locked by the JVM.
YourKit also shows us 3 main culprits for those locks, which we are going to remove one at a time.
Removing Commons DBCP
The first cause of those locks is our database connection pool, Commons DBCP, which is well-known for doing a lot of synchronization.
Let’s switch to tomcat-jdbc, which is the new Tomcat connection pool :
We have limited the number of connections to 8, which is a very small number, for two reasons:
- This is the default configuration of Commons DBCP, and we wanted to have a comparable configuration
- For this test, everything runs on the same machine, so we can’t have too many concurrent connections, or the performance will in fact decrease
On a real production system, it is very likely that a number between 30 and 100 would be a better configuration.
Testing the application again, we now achieve 910 req/sec.
Removing Webjars
Webjars is a library that is used to manage client-side libraries like JQuery or Twitter Bootstrap.
We have included a request to get JQuery in the stress test, in fact we expected this to cause some trouble: Webjars is using the same mechanism as Richfaces to provide static resources, and we already had that exact same issue with Richfaces (by the way, many other Web frameworks, like Play!, are doing the same). Indeed, the JVM is doing a big lock each time someone tries to load a Web library.
We have experienced this being an issue at a client site: we are only testing here with one Web library, but if we were using all the libraries from the application, things would be much worse.
For this particular client:
- We had a few hundred users, not enough to bother setting up a specific system (like a CDN) to handle static resources
- Every user was using the application through HTTPS, which minimized browser caching
After discussing with James Ward, the author of Webjars, we have the following best practices for using Webjars:
- Use a caching HTTP Server as a front-end (or a CDN for a bigger Web application)
- Use a framework that automatically caches Web resources. Unfortunately Spring doesn’t do it by default, But it shouldn’t be too hard to add using an interceptor
We have decided to simulate that we have a specific caching mechanism (of course, another solution is to remove Webjars and manage your Web libraries manually):
For our next steps, we have now disabled the “JS” step in our JMeter test, and have enabled the “JS no webjar” step instead. This will make our stress test use the JQuery script that is served directly by the server, without using Webjars.
So let’s get down to the results: we are now at 942 req/sec.
Removing the monitoring aspect
This last issue was created on purpose: we have a small lock in the aspect which is provided to monitor the application with JMX.
It’s in fact a very good idea, but it has a negative impact on performance. Let’s remove it:
We now reach 959 req/sec.
Conclusion of part 3
We have used our profiler to quickly see that we had some JVM locks on the application. We have removed each of them, and saw each time an increase in the performance of the application.
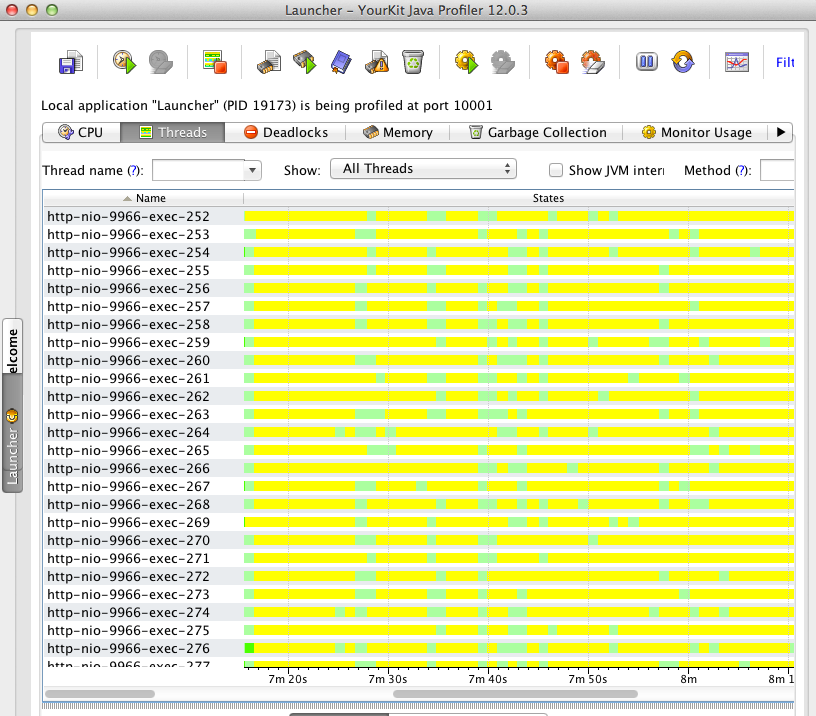
Using YourKit again, we don’t see any JVM locks any more on the application (no red threads anymore!):

Our application went up from 867 req/sec to 959 req/sec. This is of course a better result, and it would probably be even better on a real production server, which has more cores and threads than the Macbook we are using for the tests.
On part 4, we will test if we can do better with JPA than with JDBC.
[edit]
You can find the other episodes of this series here : part 1, part 2, part 4 and part 5.


